Single Cell Analysis, Made Simple

Complete your entire workflow in one software, from raw data to statistical significance, using familiar tools seamlessly blended with cutting-edge computational methods and visualizations.

High-Dimensional Power

Use OMIQ's suite of machine learning tools to bring order to complex high-dimensional data.

Dimensionality Reduction

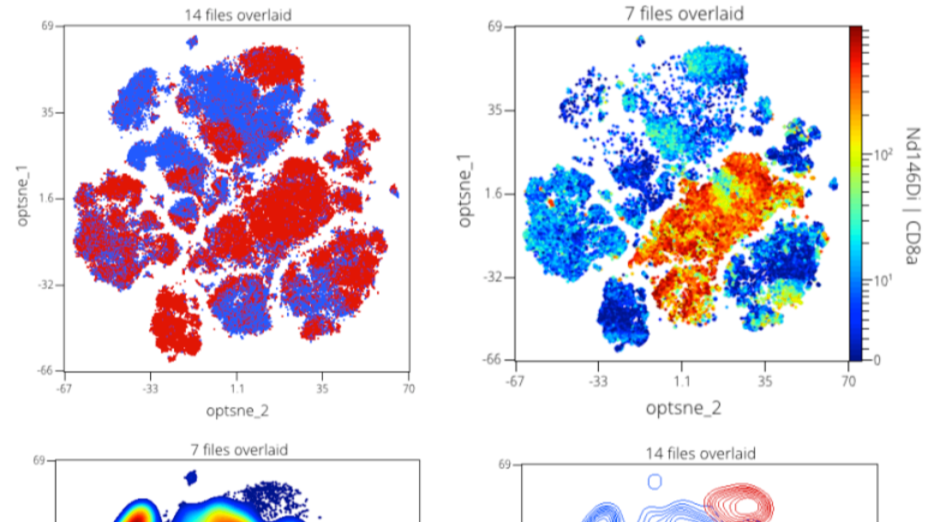
Run t-SNE, UMAP, PCA, EmbedSOM, FIt-SNE, TriMap, and more. Use opt-SNE to remove the guesswork with settings and get great results every time.

Take advantage of GPU-accelerated processing options to get results over 100x faster in some cases.

Clustering

Categorize data into populations automatically with FlowSOM, Phenograph, PARC, SPADE, ClusterX, and more.

Use graph analysis or heatmaps to deepen your understanding of stucture and patterns within data.

Statistical Differential Analysis

Cut through the noise and find what matters. OMIQ has visualizations and statistical methods to find the strongest stratifying signals aligned with clinical or experimental metadata.

Trajectory Inference

Discover and visualize paths of cellular development. Understand differentation switch points and cell fate.

Automated Data Cleaning

Everything starts with clean data. Incorporate algorithms such as flowAI and flowCut into your workflow to help automate and standardize this key step of analysis.

Normalization

Tame batch effects and other unwanted signal differences between files in order to improve comparability for analysis and visualization.

Classical Analysis

OMIQ has you covered for your classic manual analysis needs

Compensation and Scaling

Convenient functionality for adjusting compensation and setting scales.

Gating

Interactive display boundaries for plots. Filter data down by gate or filter using subsampling.

Figures and Reporting

Integrated figures and reporting allow you to achieve meaningful results faster.

Export Results

Export individual plots or batch reports from an OMIQ Figure. Multiple formats are available, such as PNG, SVG, PDF, and PPT.

Modern Cloud Platform

Powerful, easy-to-use software that accelerates your journey from data to insights

Share and Collaborate

Choose permission levels and add colleagues with a click. Get to results faster, together.

Form connections, share datasets, share workflows, adjust roles and permissions and create easy to use groups for collaboration.

Secure and Auditable

Your data is safe with OMIQ's enterprise-grade security, including end-to-end and at-rest encryption, and organizational security-in-depth.

All analysis in OMIQ is stored as a traceable sequence of steps called a Workflow. Workflows can be locked for safekeeping.

Flexible Data Input

FCS, CSV, LMD. Regardless of your input format, OMIQ will accept it. Clinical and experimental metadata can be cross-referenced manually or automatically to help OMIQ extract the insights that matter.

Customizable Plugins and Scripts

With plugins, your code can run inside OMIQ. Share your algorithms with the world or keep them private for your enterprise only.

Autogating ServicesADD-ON

Bespoke automated data analysis pipelines for cytometry data providing rapid, robust and reproducible results

Automated Gating

Automated gating pipelines are collaboratively customized for each client to robustly reproduce your existing gating hierarchy.

Once the pipeline is designed, our gates will adjust themselves for each sample using a robust, reproducible framework.

Quality Checking

With our automated approaches, the data QCs itself. We build the checks into the gating process to make sure FCS files are internally consistent, match with patient files, and that all the reportables that need to be filled out are done correctly.

OMIQ Integration

Reusable R pipeline integrates seamlessly into OMIQ. Produced gates are native OMIQ format. Built-in compliance with OMIQ with no IT involvement.

OMIQ Features

Explore a list of OMIQ’s features and services

Classic Analysis

  • Adjust compensation
  • Set scales
  • Gating
  • Make figures
  • Visual batch reports
  • Statistical batch reports

Data Management

  • Reproducible workflows
  • Import fcs, csv and lmd files
  • Customizable plugins
  • Auditable and reproducible
  • Enterprise grade security
  • GxP compliance
  • Sharing and collaboration

High Dimensional Analysis

  • Dimensionality Reduction with t-SNE, UMAP, PCA, EmbedSOM, FIt-SNE, TriMap
  • Clustering with FlowSOM, Phenograph, PARC, SPADE, Cluster
  • Statistical differential analysis
  • Trajectory interference
  • Automated data cleaning with flowAI and flowCut
  • Normalization

Autogating

  • Automated gating
  • Biomarker discovery
  • Quality checking
  • Customized reports
  • Reusable R pipeline
Experience the future of flow cytometry.